 The graph to the left shows how much fuel is used each year by residents and businesses on Catalina Island. The Sustainable Action Group hopes to lower both numbers by improving public transportation. [Sustainable Action Group].
 |
The image to the right illustrates Catalina's resource cycle. The Sustainable Action Group aims to lower gas, diesel, and propane usage. Also, one can see how sewage and landfill contribute to pollution. [Sustainable Action Group]
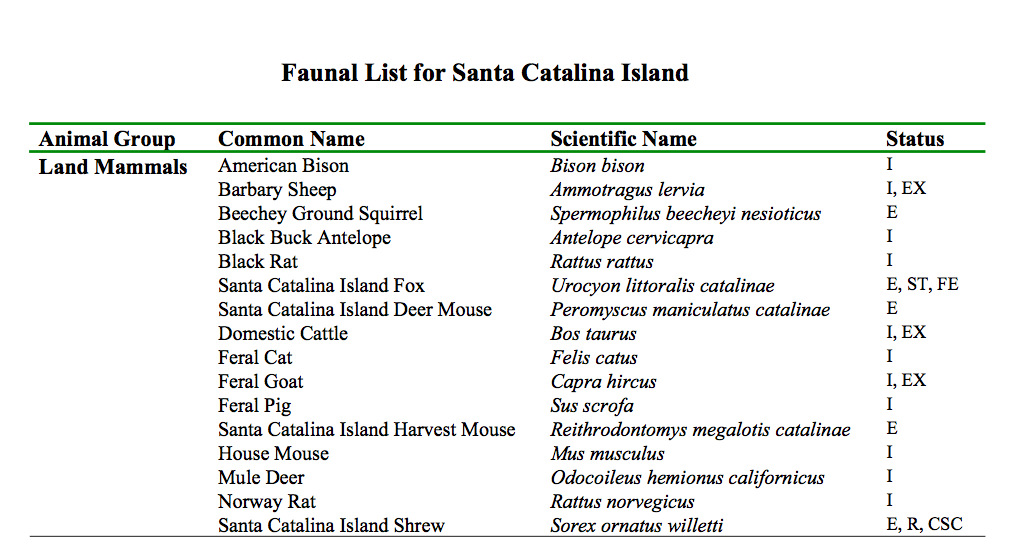
The table to the left shows the land mammals on Catalina Island and their current status.
I = Introduced
EX = Extirpated, Completely Removed
ST = State Threatened
R = Rare
E = Catalina Island Endemic
CSC = CA Species of Special Concern
[Catalina Island Conservancy]
No comments:
Post a Comment